Benefits of hc1 Operations Management™
hc1 Operations Management™ goes beyond basic EMR reporting by combining advanced lab analytics technology with industry-leading laboratory consulting expertise. Our unique approach empowers your team to optimize lab workflows, boost lab productivity, and elevate quality and service—driving meaningful, measurable improvements across your lab operations.
Laboratory technical and leadership expertise, blended with lean Six Sigma and project management, to bring the top proven best practices
Improve on both the clinical and business aspects of running a successful laboratory
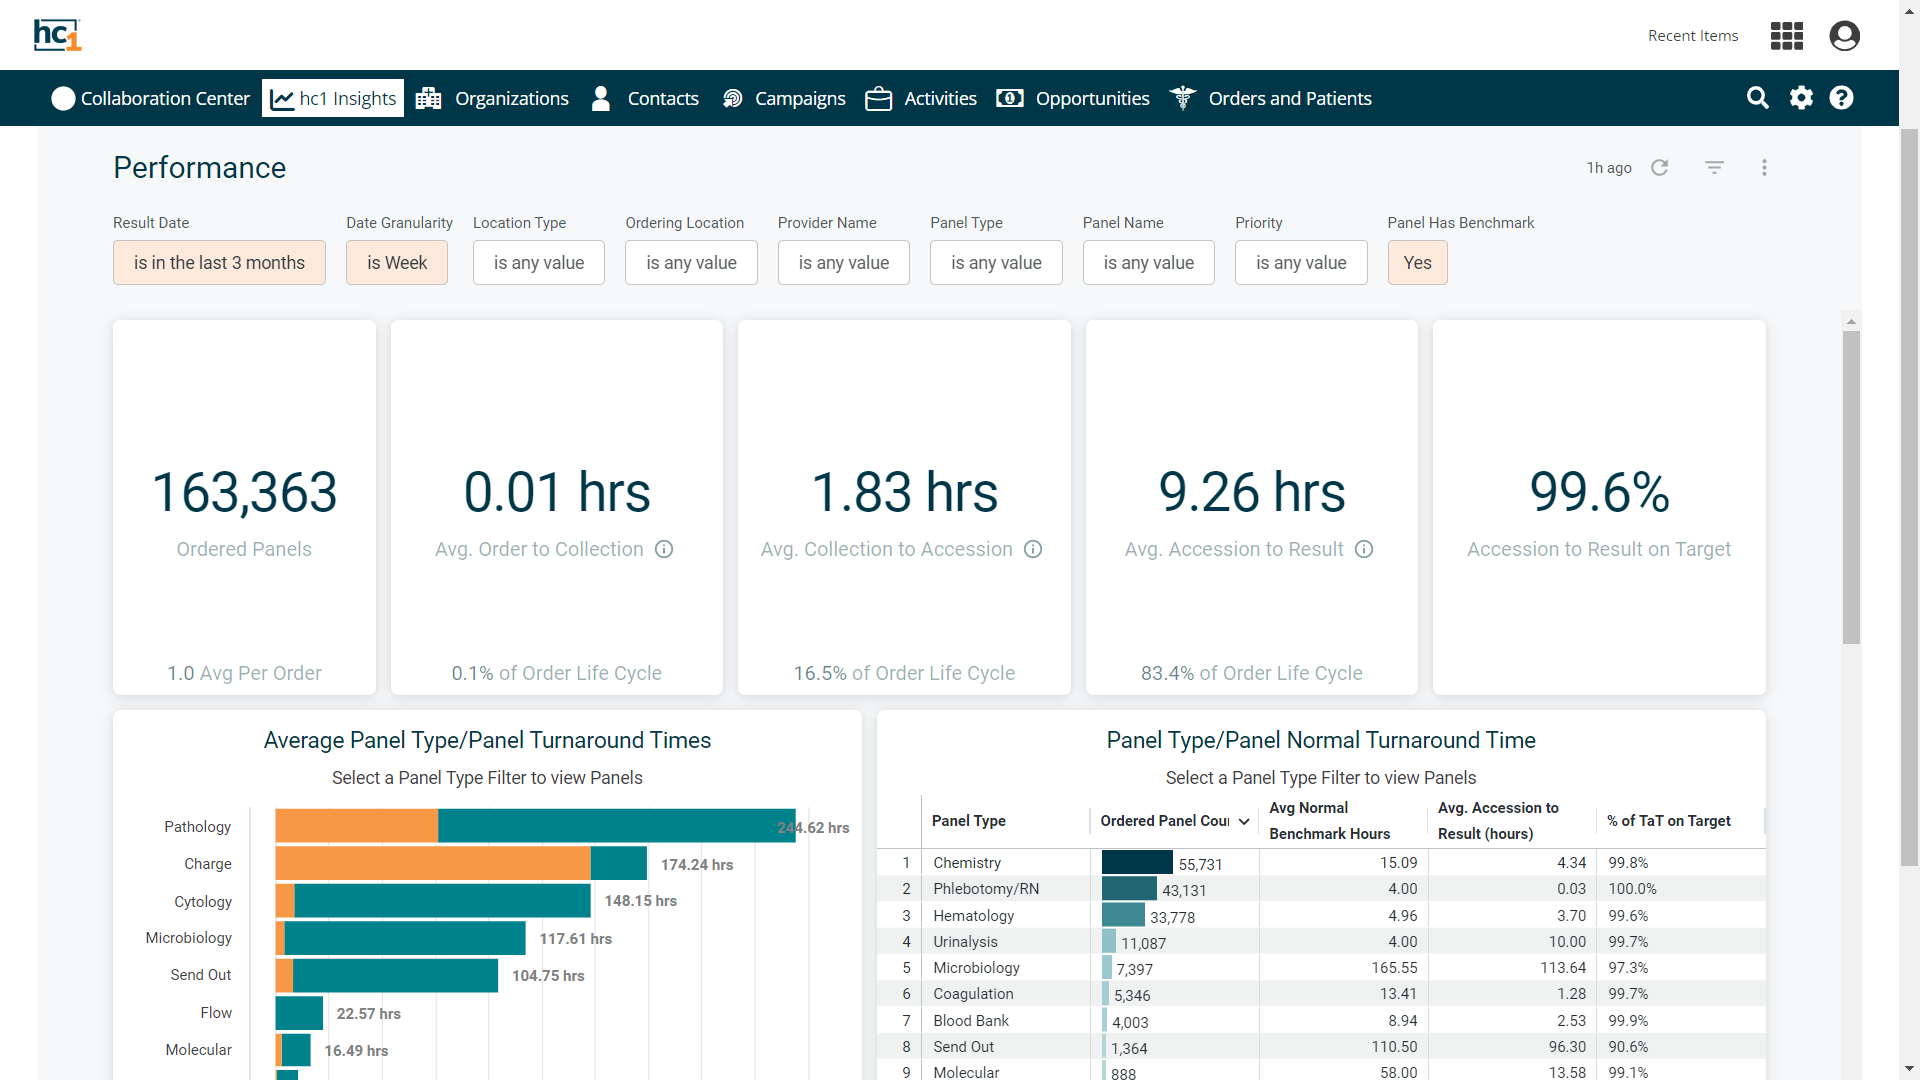
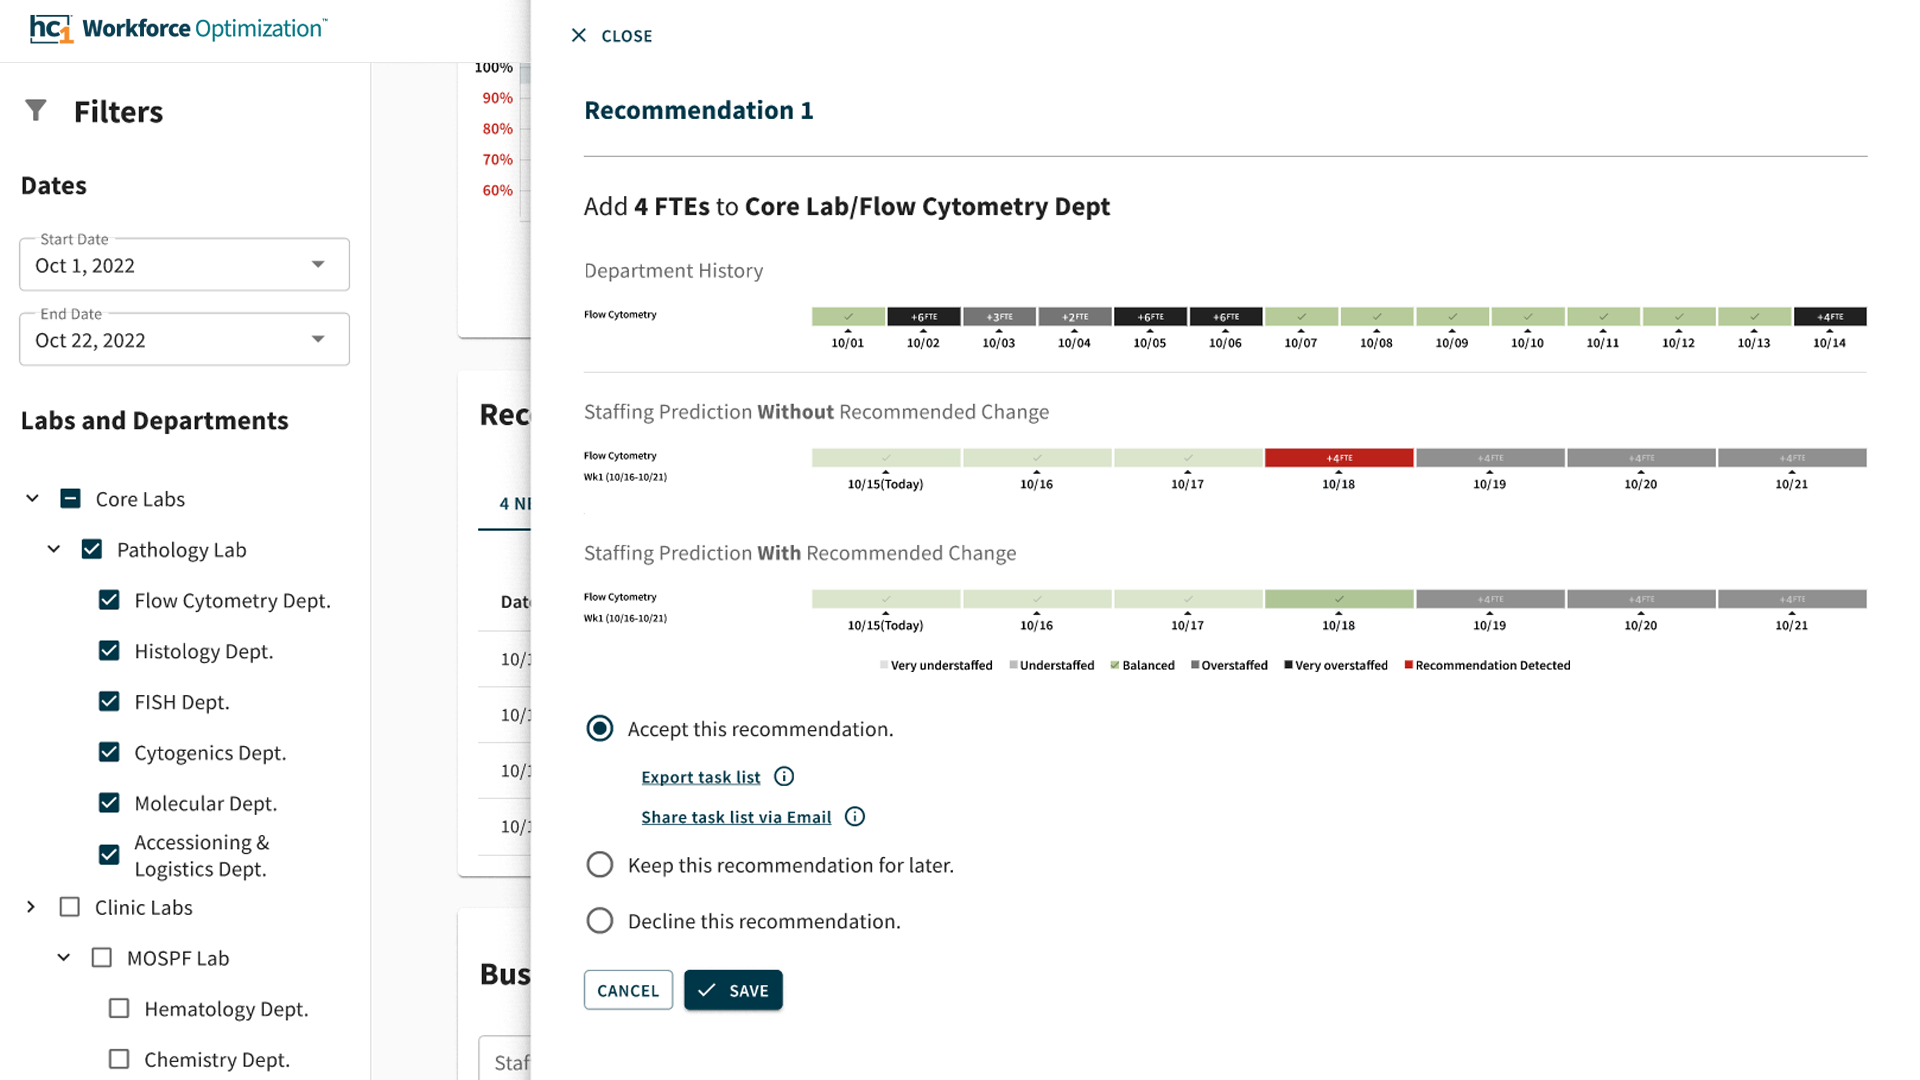
The hc1 Lab Insights Platform™ analyzes real-time data to uncover actionable insights, while advanced workflow automation further streamlines operations.
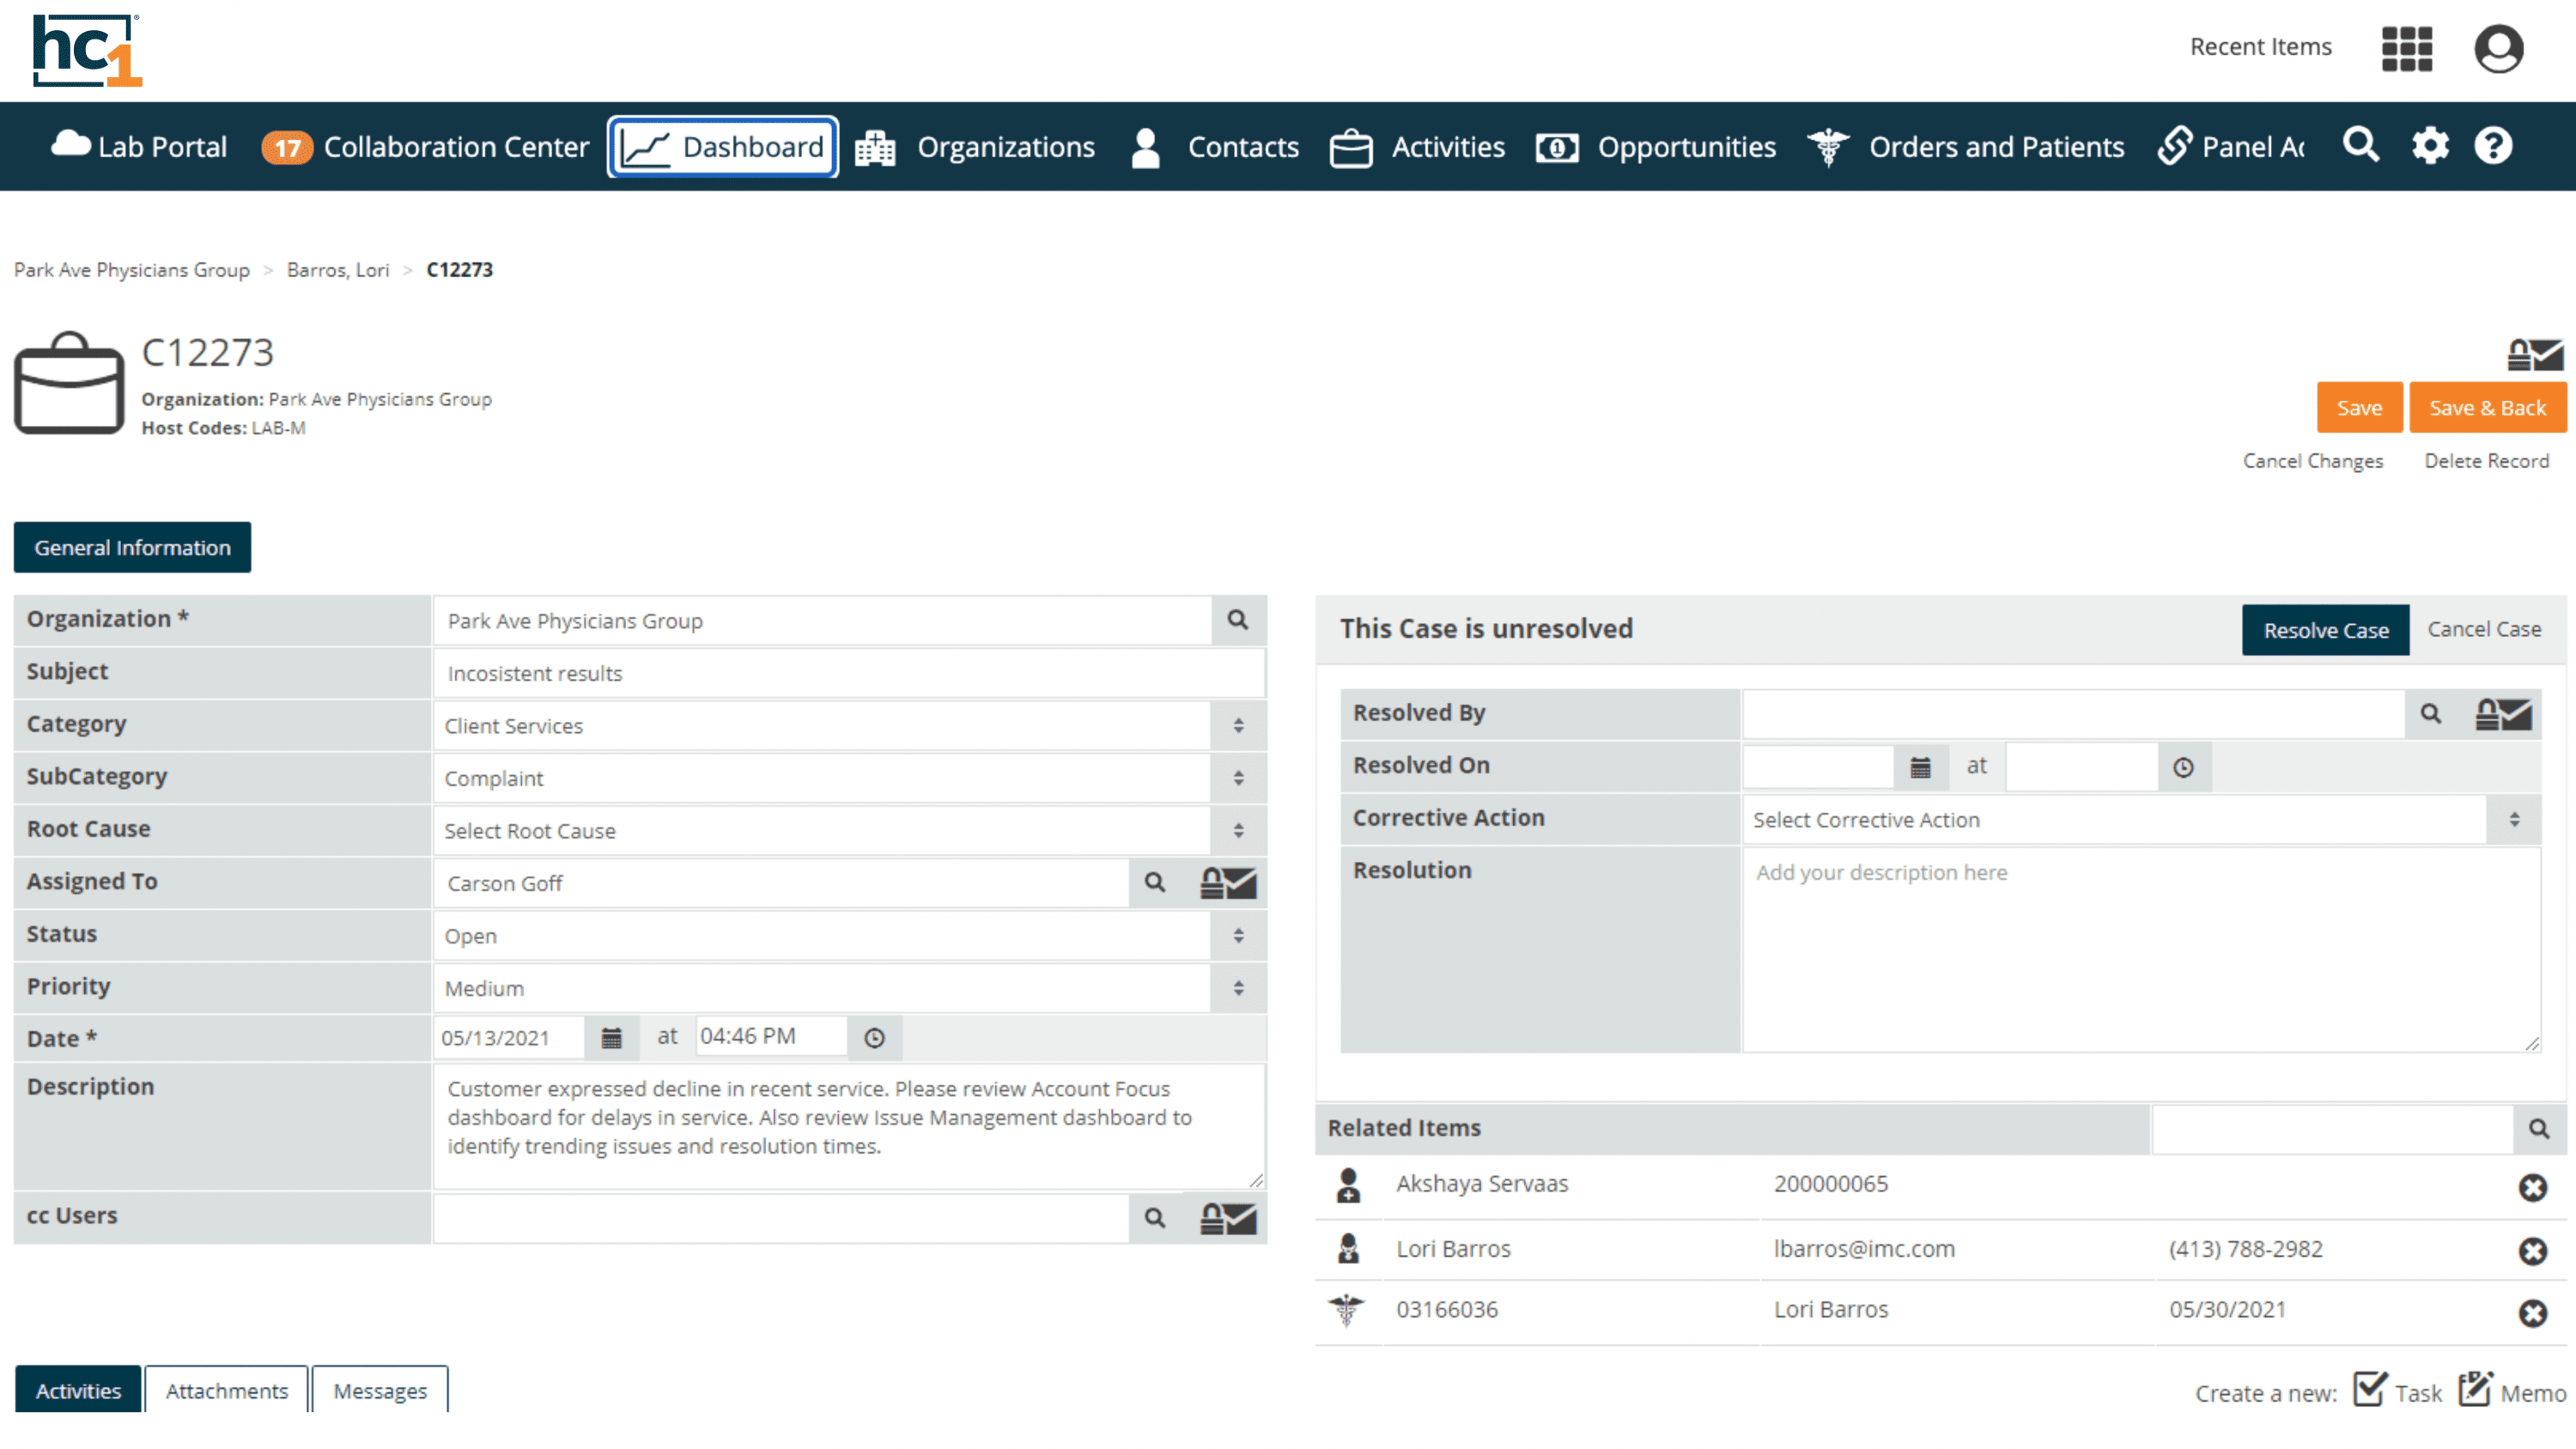
Operations Management comes standard with healthcare record types and fields while also allowing you to create custom fields and screen layouts.
Customizable strategies tailored to meet your health system’s and hospital’s needs
Improved workflows, increased productivity, reduced cost, increased patient safety, enhanced quality and service, and increased patient and provider satisfaction